
취미와 밥줄사이
[Visualization] seabron libarary : Distribution Visuals 본문
Python/Visualization
[Visualization] seabron libarary : Distribution Visuals
취미와 밥줄사이 2021. 5. 9. 16:38이 게시물은 캐글 노트북을 통해 학습한 내용을 번역하고 정리한 글 입니다. 스스로 복습하기 위하여 작성 하였습니다. 더 자세한 내용을 알고싶은 분은 하단의 링크를 참조 해주세요.
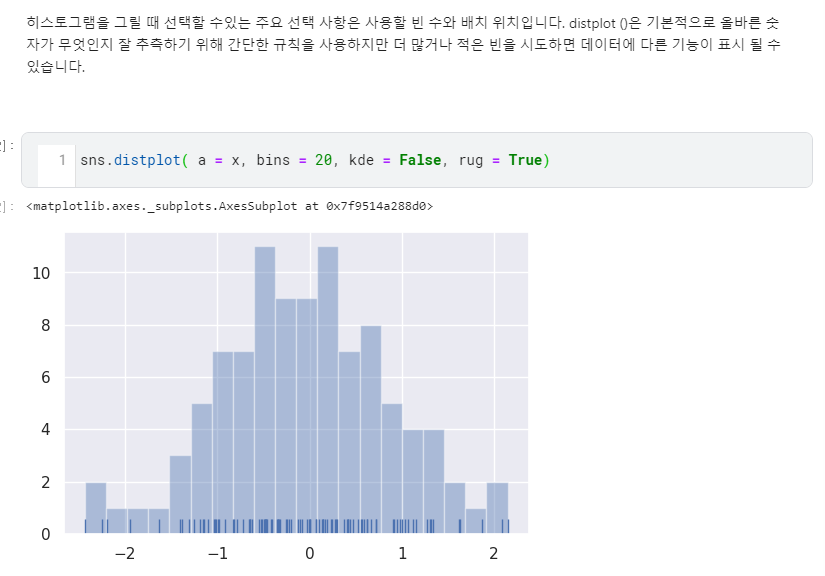
Histogram


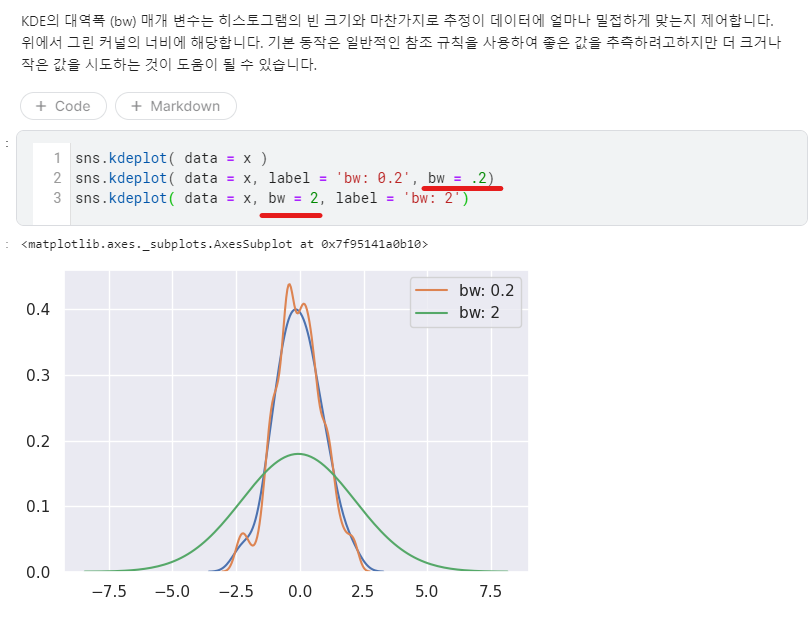
KDE(Kernel Density Estimation)


Reference
www.kaggle.com/ravichaubey1506/complete-data-visualization-tutorial-seaborn
Complete Data Visualization Tutorial Seaborn !!!
Explore and run machine learning code with Kaggle Notebooks | Using data from multiple data sources
www.kaggle.com
seaborn.pydata.org/generated/seaborn.catplot.html?highlight=catplot#seaborn.catplot
seaborn.catplot — seaborn 0.11.1 documentation
The kind of plot to draw, corresponds to the name of a categorical axes-level plotting function. Options are: “strip”, “swarm”, “box”, “violin”, “boxen”, “point”, “bar”, or “count”.
seaborn.pydata.org
'Python > Visualization' 카테고리의 다른 글
| [Visualization] 경기도 파주시 미세먼지 신호등 위치 시각화 (0) | 2021.05.10 |
|---|---|
| [Visualization] seaborn libarary : BoxPlot and ViolinPlot (0) | 2021.05.09 |
| [Visualization] - seaborn / Categorical Scatterplots (0) | 2021.05.09 |
| [Visualization] seaborn 라이브러리의 Facets (0) | 2021.05.09 |
| [Visualization] seaborn 라이브러리 scatterplot 사용법 정리 (0) | 2021.05.09 |
'Python/Visualization' Related Articles
more


